Otero County Health Department Covid Update - Colorado COVID-19 Modeling Group Report
Description: 12-4-20 Colorado Covid-19 Modeling Group Report.

THIS IS A RAPIDLY EVOLVING AND FLUID SITUATION. INFORMATION AND ACTION ARE SUBJECT TO CHANGE AT ANY TIME. BE PREPARED TO BE FLEXIBLE AND PATIENT.
The situations, numbers, website links, data, and etc. described below were current as of Monday 12/7/2020 at 10:11 am.
PLEASE DISTRIBUTE THIS WIDELY
12/7/2020 Crowley/Otero COVID-19 Update #1: 12/4/2020 Colorado COVID-19 Modeling Report
Please take the time to read and understand this entire message.
Internet links: Before I send out each update, I check the links to make sure they are active. However, links do change from time to time, so the links I sent out today may not be the same tomorrow. You may have to search around a bit.
Hello to all, the Colorado Department of Public Health and Environment (CDPHE) and the Colorado School of Public Health (ColoradoSPH) have released an updated Colorado COCID-19 modeling report (dated 12/4/2020). Key findings from the modeling report are as follows:
ü An estimated 1 of 40 Coloradans are infectious, the highest prevalence to date.
ü The effective reproductive number is approximately 1.2, lower than last week but indicating continued growth of the epidemic. Infections are continuing to rise, albeit at a slower rate than last week. Estimated transmission control has increased from 66% to 71% since last week.
ü These estimates reflect infections occurring before Thanksgiving and do not yet reflect any impact of Thanksgiving travel or gatherings.
ü Over the next two weeks, COVID-19 hospital demand will likely reach or exceed 2,120 beds, including 665 ICU beds. Because of increased contacts over Thanksgiving, demand could be greater.
ü On the current trajectory, COVID-19 hospital and ICU demand may stay within surge capacity estimates over the next four weeks, even with modest increases in contacts over the Thanksgiving holiday. But further reductions in transmission control, associated with increases in contacts over the holidays could lead to hospital and ICU demand above surge capacity estimates.
You can read the full modeling report below.
It’s up to us.
Richard Ritter, Executive Director
Otero County Health Department
13 West 3rd Street, Room 111
La Junta, Colorado 81050
719-383-3045 (Office)
719-383-3060 (Fax)
The Current State of COVID-19 in Colorado
12/04/2020
Prepared by the Colorado COVID-19 Modeling Group
Colorado School of Public Health: Andrea Buchwald, Elizabeth Carlton, Debashis Ghosh, Irina Kasarskis, Jonathan Samet, Emily Wu; University of Colorado School of Medicine: Kathryn Colborn; University of Colorado-Boulder Department of Applied Mathematics: Sabina Altus, David Bortz; University of Colorado-Denver: jimi adams; Colorado State University: Jude Bayham
For Contact: Jon.Samet@CUAnschutz.edu
Summary
• The effective reproductive number is approximately 1.2, lower than last week but indicating continued
growth of the epidemic. Infections are continuing to rise, albeit at a slower rate than last week. Estimated
transmission control has increased from 66% to 71% since last week.
• An estimated 1 of 40 Coloradans are infectious, the highest prevalence to date.
• These estimates reflect infections occurring before Thanksgiving and do not yet reflect any impact of
Thanksgiving travel or gatherings.
• Over the next two weeks, COVID-19 hospital demand will likely reach or exceed 2,120 beds, including 6,65
ICU beds. Because of increased contacts over Thanksgiving, demand could be greater.
• On the current trajectory, COVID-19 hospital and ICU demand may stay within surge capacity estimates over the next four weeks, even with modest increases in contacts over the Thanksgiving holiday. But further reductions in transmission control, associated with increases in contacts over the holidays could lead to hospital and ICU demand above surge capacity estimates.
Snapshot of Current SARS-CoV-2 Transmission in Colorado Based on COVID-19
Hospitalization Data Through 11/30
Effective reproduction number: 1.17 (95% CI: 1.12, 1.21).
Infections are increasing.
Estimated prevalence of infections: Approximately 2,500 (95% CI: 2,372, 2,583) of every 100,000 Coloradoans or 1 in every 40 Coloradans are currently infectious.
The estimated infection prevalence is higher than last week.
Estimated number of infections to date: Approximately 16.5% (95% CI: 16.3%, 16.5%) of the Colorado population has been infected to date.
Estimated current level of transmission control: 71% (95% CI: 70%, 72%) for the period of 11/07 to 11/17.
There is an approximate 71% reduction in total transmission-relevant contacts, including reductions due to mask-wearing, physical distancing, contact tracing, self-isolation, and all other policy and behavioral changes compared to uncontrolled transmission, as in the very early days of the pandemic.
Snapshot of the Potential Future Trajectory of SARS-CoV-2 in Colorado
In the next two weeks: If we remain on the current trajectory, there is a 50% chance that at least 2,120 patients will be hospitalized with COVID-19, including 665 patients in the ICU.
Introduction
We used our age-structured SEIR (susceptible-exposed-infected-recovered) model and COVID-19 hospital census data to characterize the current status of the COVID-19 epidemic in Colorado and the collective impact of efforts to date to reduce the spread of the SARS-CoV-2 virus. We use these estimates of the current state of the epidemic to generate projections of the potential future course of SARS-CoV-2 in Colorado under different scenarios of transmission control measures. These include estimates of hospital needs over the next two weeks based on the current estimated trajectory, and long-term projections that consider the impact of changes in transmission control level due to policies and/or behaviors.
The model has been parameterized to Colorado-specific data whenever possible. For example, the length of time a COVID-19 patient spends in the hospital varies by age and over time and is based on data provided by Colorado hospitals. Further details and a link to documentation are provided in the appendix at the bottom of this report.
The estimates presented in this report are based on hospitalization data through 11/30.
COVID-19 Hospitalizations
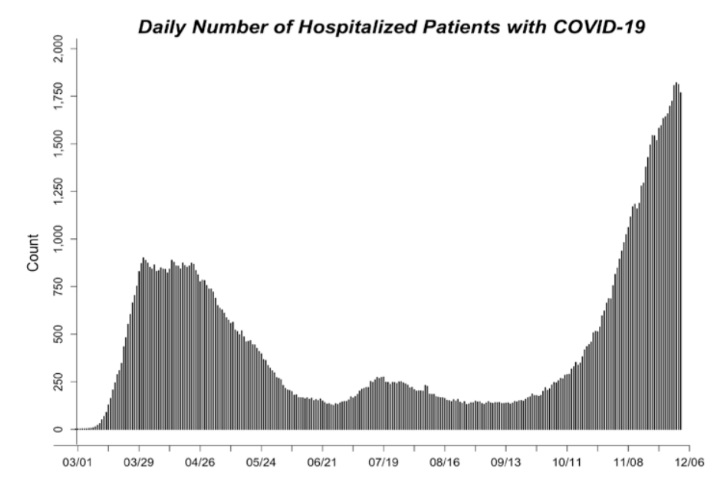
Figure 1 shows the daily number of people hospitalized with COVID-19 since March 2020, when the first case of SARS-CoV-2 was reported in Colorado. COVID-19 hospitalizations are a sensitive measure of SARS-CoV-2 transmission. While many SARS-CoV-2 infections are not captured by surveillance systems, we expect that almost all COVID-19 hospitalizations are identified.
 Figure 1 (above). Daily count of hospitalized COVID-19 cases through 11/30. The time series of COVID-19 hospitalizations in Colorado is based on hospitalization data provided by CDPHE through 4/07/2020 and the EMResource hospital census of COVID-19 hospitalizations starting 4/08/2020 (EMResource hospital census appeared to undercount COVID-19 hospitalizations before that date).
Transmission Control
Transmission control is an estimate of the collective impact of behaviors and policies such as mask wearing, physical distancing, case isolation, contact tracing, and moving activities outside. When transmission control is 0%, spread of infections is uncontrolled, as in the very early days of the pandemic. When transmission control is close to 100%, the spread of the virus from an infected person to others is rare. We estimate transmission control for each two-week period since March (Figure 2). Transmission control is estimated by fitting model output to hospitalization data using model fitting approaches.
Our current estimate of transmission control is 71% (95% CI: 70%, 72%). This estimate is for the period 11/07 to 11/17, given the timespan between infection and hospitalization.
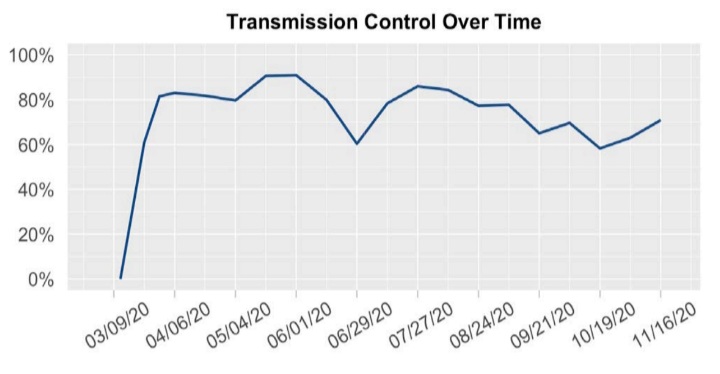 Figure 2 (above). The estimated transmission control value for each two-week period since the beginning of the epidemic. On the graph, the value is shown for the mid-point of each two-week period. Transmission control is estimated using model fitting approaches to align model output with COVID-19 hospitalizations.
Model Fit
We assess model fit by comparing the model-estimated number of hospitalizations to actual hospitalizations.
Figure 3 shows the current estimated trajectory of hospitalizations, based on the most recent model-fit, compared to the daily reported number of people hospitalized with COVID-19. For reference, a line showing the estimated trajectory one-week prior is also shown. A figure showing model fit since the beginning of the pandemic is provided in the appendix.
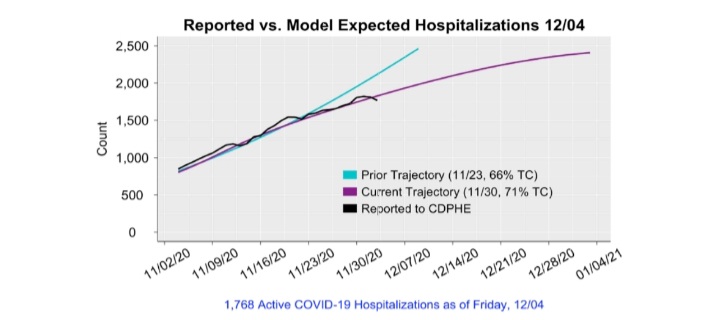 Figure 3 (above). The projected course of COVID-19 hospitalizations if Colorado were to remain on the current estimated trajectory (purple line) or on the trajectory estimated one week prior (turquoise line). Each trajectory is generated assuming transmission control were to remain at the current or one-week prior estimate.
The Effective Reproduction Number
The effective reproduction number (Re) is a measure of how rapidly infections are spreading or declining. When the effective reproduction number is below 1, infections are decreasing. When the effective reproduction number is above 1, infections are increasing. The effective reproduction number is estimated using our age-structured SEIR model fit to hospitalization data.
Our current estimate of Re is 1.17. Due to the lag between infections and hospitalizations, this estimate of RE reflects the spread of infections occurring on approximately 11/17. The estimated values of the reproductive number since March are shown in Figure 4 and the most recent three estimates are presented in Table 1.
Table 1 (below). Estimates of the effective reproduction number (Re) in Colorado over the last three weeks based on the SEIR model. We also include estimates from RT-Live, an external source that which calculates the reproductive number using reported SARS-CoV-2 cases and testing data.
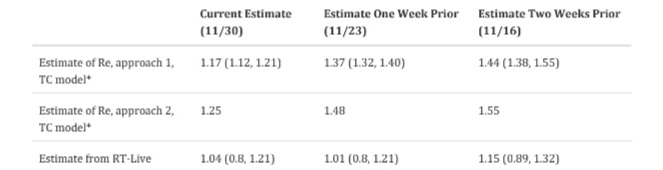
*Our estimates are based on hospitalization data through the date listed. Estimates from the external sites are extracted on the date listed. Due to the lag between infection and hospitalization, our estimates reflect transmission approximately 13 days prior to the date listed. Approach 1 uses model output to estimate the average number of new cases generated by existing cases, accounting for the latent period and duration of infectiousness. The second method uses the model structure to estimate the dominant eigenvalue for a matrix describing population flows across the model compartments.
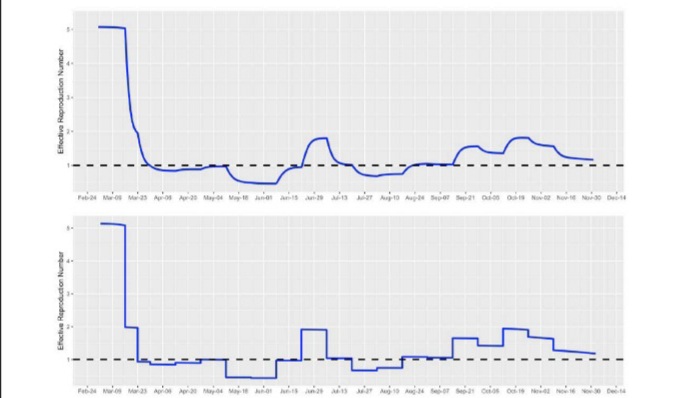 Figure 4 (above). Estimates of the effective reproduction number over time, using approach 1 (top) and approach 2 (bottom) based on the TC model.
Infection Prevalence
Infection prevalence provides an estimate of the proportion of the population that is currently (as of 11/30) infected with SARS-CoV-2 and capable of spreading infections. At higher levels of infection prevalence, susceptible individuals are more likely to encounter infectious individuals among their contacts. Because many people experience no symptoms or mild symptoms of COVID-19, many infections are not identified by surveillance systems. The estimates we present here are intended to provide an approximation of all infections, including those detected and not detected by the Colorado Electronic Disease Reporting System (CEDRS).
Infection prevalence is estimated using our age-structured SEIR model fit to hospitalization data. These estimates are generated by assuming the most recent transmission control parameter (estimated for the period 11/07 to 11/17) remains at the estimated value through 11/30. These estimates are sensitive to the model assumptions, including assumptions about the probability an infected individual will be symptomatic and require hospital care, and assumptions about length of hospital stay, which vary over time; we assume that all variables vary by age category.
We estimate that there are approximately 145,104 (95% CI: 138,530, 150,845) infectious individuals in Colorado at present (11/30): approximately 2,500 (95% CI: 2,372, 2,583) of every 100,000 Coloradoans or 1 in every 40 people (95% CI: 39, 42).
Figure 5 illustrates the estimated infection prevalence over time in comparison to the number of hospitalized COVID-19 patients. Because, on average, COVID-19 patients are spending less time in the hospital now than at the start of the pandemic, there are more infections are estimated per hospitalized COVID-19 patient now compared to March when stays were substantially longer.
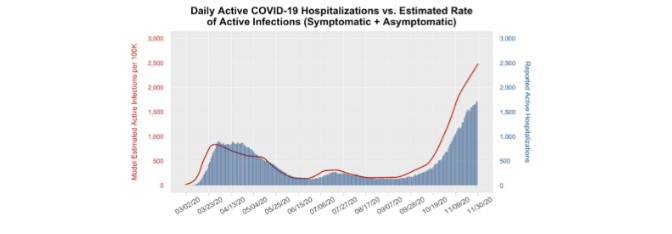 Figure 5 (above). Estimated daily number of people (per 100,000 population) who are infectious and infected with SARS-CoV-2 (point prevalence), as shown on the red line, and the number of actual COVID-19 hospitalizations (blue bars). The number of infectious individuals is inferred using the model and based on hospitalizations.
Case Detection
Comparing observed to model-estimated infections, we estimate that approximately 38% of infections were detected by state surveillance systems, including both asymptomatic and symptomatic infections in the two week period from 11/07 to 11/20 (Figure 5).
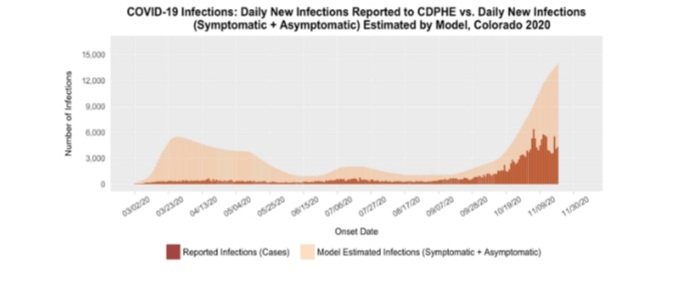
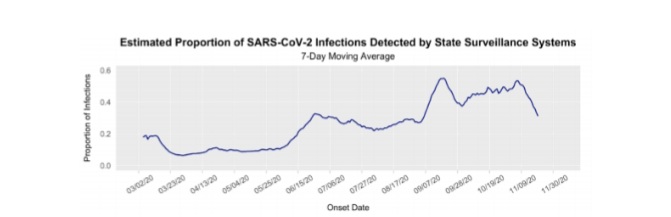
Figure 6 (above). Estimated daily number of new (incident) SARS-CoV-2 infections based on the SEIR model (light orange graph) and reported cases (dark orange graph) over time shown in the top panel. Lower panel shows the 7-day moving average of the estimated proportion of SARS-COV2 infections that are being captured by Colorado state surveillance systems, over time. The proportion detected is estimated by dividing the total number of new cases captured by state surveillance systems by the model-estimated number of new infections each day. The number of cases captured by the state surveillance systems is the number of cases reported by CDPHE, using the onset date of symptoms (if onset date is not available, onset date is imputed by CDPHE using a proxy distribution of recent onset dates). Data are shown through 11/20 to account for typical lags between symptom onset and case report.
Cumulative Infections
As more people develop immunity, due to vaccination or prior infection, the spread of infections slows because infectious individuals are less likely to encounter individuals that are still susceptible to infection. The estimated cumulative number of infections provides an estimate of the percent of the population that may be immune, although we still do not know how long immunity lasts after an infection. As a vaccine becomes available and our understanding of SARS-CoV-2 immunity changes, these estimates will be updated.
The cumulative number of infections is estimated using our age-structured SEIR model fit to hospitalization data.
As with our prevalence estimates, these estimates are generated by assuming the most recent transmission control parameter estimate remains at the estimated value through 11/30. These estimates are sensitive to model assumptions, including assumptions about the probability an infected individual will be symptomatic and require hospital care, as well as assumptions about length of hospital stay, which varies over time; all of the above are variables that we assume vary by age.
We estimate that approximately 960,884 (95% CI: 954,490, 966,238) people in Colorado, or 16.5% (95% CI: 16.3%, 16.5%) of the population, have been infected to date (11/30).
Reported Infections and Hospitalizations by Age and Race/Ethnicity
Like many infectious diseases, COVID-19 is not equally distributed across the population. Some groups may face higher exposures and/or more severe health effects. We use reported case and hospitalization data provided by CDPHE to examine the distribution of infections and hospitalizations by age group, as well as by race and ethnicity.
Age groups are defined to align with the four age groups used in the model.
Reported SARS-CoV-2 Cases by Age Group. Figure 6 shows the 7-day moving average of reported new SARS-CoV-2 infections by age group.
People under age 40 account for 54% of reported SARS-CoV-2 cases in the last two weeks (11/09 to 11/23).
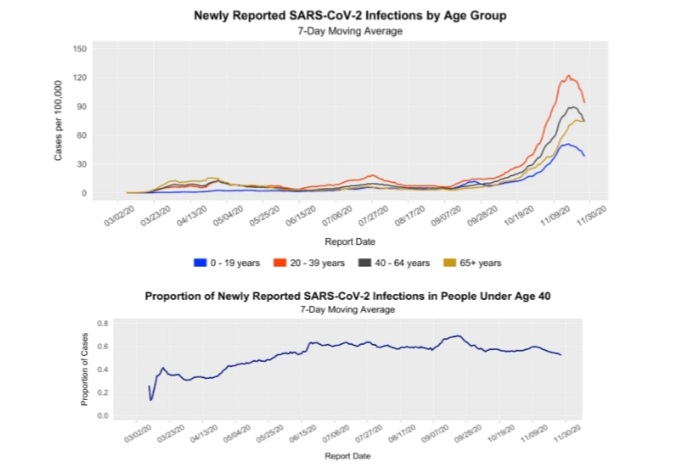 Figure 7 (above). Distribution of 7-day moving average of newly reported SARS-CoV-2 infections by age group (top) and the proportion of all cases among individuals under 40 (bottom). Reported cases are based on CDPHE data and shown by report date. Incident cases per 100,000 were obtained by standardizing weekly reported age-specific case and hospitalization counts to the Colorado population distribution by age, gathered from the Colorado Census 2020 estimates. Data are shown through 11/23, to account for typical lags in collection of age data for reported cases.
COVID-19 Hospitalizations by Age Group. Figure 7 shows the daily count of individuals hospitalized with COVID-19 by age group from March through the present, based on COvid Patient Hospitalization Surveillance (COPHS) provided by CDPHE. Due to lags in reporting, COPHS data include hospitalizations through 11/25.
People under age 40 account for 12% of COVID-19 hospital use over the last two weeks (11/12 to 11/25).
People age 40 to 64 account for 37% of COVID-19 hospital use over the last two weeks.
People age 65+ account for 51% of COVID-19 hospital use over the last two weeks.
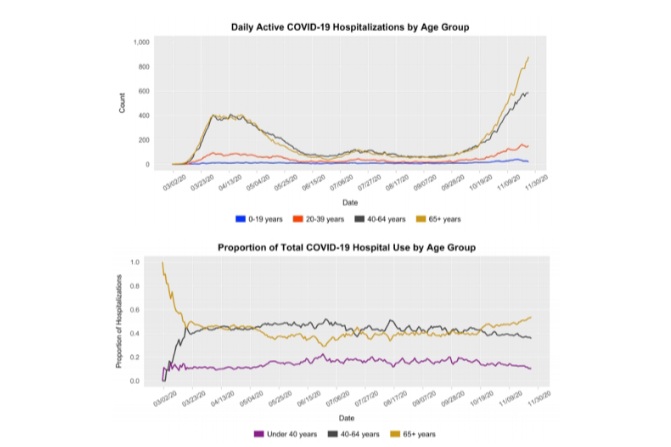 Figure 8 (above). The number of individuals hospitalized with COVID-19 by age group from March through the present (top) and the proportion of COVID-19 hospital beds occupied by individuals under 40 years, 40-64 years, and 65+ years (bottom). Data based on COvid Patient Hospitalization Surveillance (COPHS) through 11/25.
COVID-19 Reported Cases by Race/Ethnicity. Figure 8 shows the number of reported cases by race/ethnicity from March through the present.
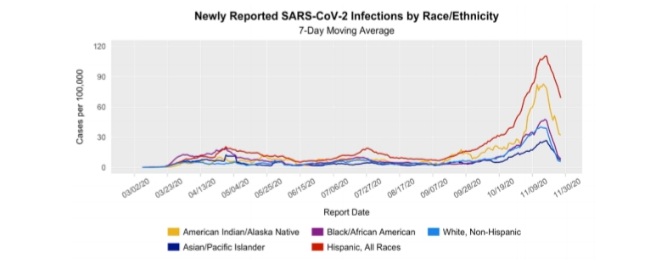 Figure 9 (above). Distribution of 7-day moving average of newly reported SARS-CoV-2 infections by race and ethnicity in Colorado. Reported cases are based on CDPHE data and shown by report date. Cases per 100,000 were obtained by standardizing weekly reported race-specific case counts to the race/ethnicity distribution of the state of Colorado gathered from the CDPHE COVID-19 Case Summary Dashboard. These standardized estimates combine Asian and Native Hawaiian/Pacific Islander races and exclude Other/Unknown races (which account for 54% of observations over the last two weeks). Data is shown through 11/23 to account for lags in collection of race/ethnicity data for reported cases.
Near-Term Forecast
We generated estimated hospital and ICU demand over the next two weeks assuming Colorado remains on the current trajectory and accounting for uncertainty in our current estimated trajectory (Figure 10). In two weeks, there is a 50% chance that at least 2,120 patients will be hospitalized with COVID-19, including 665 patients in the ICU if we remain on the current trajectory.
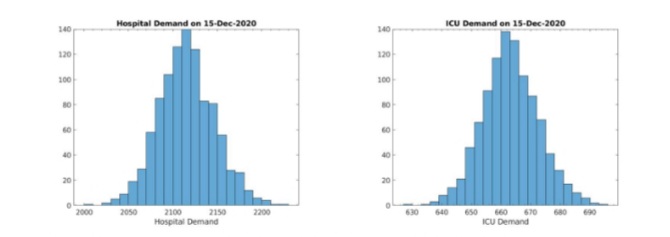 Figure 10 (above). Estimated number of hospitalized COVID-19 patients (left) and COVID-19 patients requiring ICU care (right) in ttwo weeks if we remain on the current trajectory. These estimates are based on 10,000 simulated runs of the model, with 1,000 of those runs randomly selected for visualization.
Long-Term Projections
We generate projections of future hospital and ICU demand under the following scenarios:
• Scenario 1. Colorado remains on the current trajectory (71%), as shown in Figures 11, 12 and 13.
• Scenario 2. Colorado shifts to 80% transmission control (TC) on Friday, 12/4, as shown in Figure 14.
• Scenario 3. Colorado shifts to 60% transmission control (TC) on Friday, 12/4, as shown in Figure 15.
In each of these scenarios, we evaluate the potential impact of temporary increases in contacts over the Thanksgiving and winter holidays due, for example, to holiday gatherings and travel. Because we do not yet know how much contacts change over the holidays, we run simulations for a range of changes – from a 10% to 30% absolute increase in contacts during these periods.
A note about uncertainty. This section includes projections based on the scenarios outlined above, not predictions. There is considerable uncertainty about how policies and behaviors over the last few weeks will influence the course of the epidemic in the weeks ahead. In addition, incomplete understanding of the virus creates uncertainty. For example, if immunity wanes in the months after infection, the magnitude of the peaks may be higher than shown in these scenarios – particularly in the 71% and 60% scenarios where the timing of the peak depends on reaching herd immunity. It is possible that care demand peaks sooner, or later and with greater magnitude, depending on policy, behaviors and immunity. While the projections are shown through 2021, the course in 2021 is highly uncertain at present.
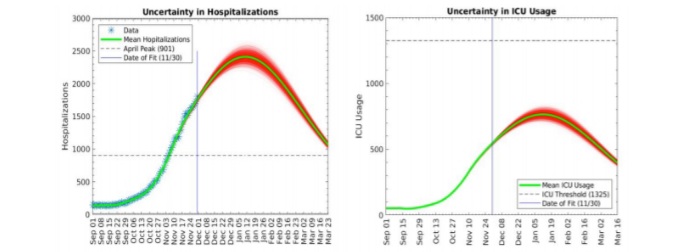 Figure 11 (above). Estimated number of hospitalized COVID-19 patients (left) and COVID-19 patients requiring ICU care (right) if we remain on the current trajectory. Additional lines show the range of uncertainty in the projection. These estimates are based on 10,000 simulated runs of the model, with 1,000 of those runs randomly selected for visualization. The red band around the mean provides an indication of uncertainty.
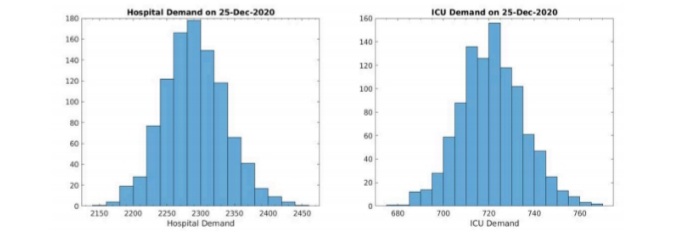 Figure 12 (above). Probability distribution estimating the number of hospitalized COVID-19 patients (left) and COVID-19 patients requiring ICU care (right) on December 25th in four weeks if we remain on the current trajectory, not accounting for changes in contacts over the Thanksgiving holiday. These estimates are based on 10,000 simulated runs of the model, with 1,000 of those runs randomly selected for visualization.
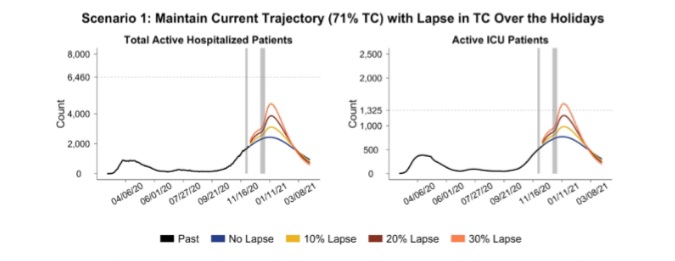 Figure 13 (above). Projected daily total number of patients actively hospitalized for COVID-19 (left) and active COVID-19 ICU patients (right), assuming transmission control remains at current levels (71%) as indicated by the blue line. This scenario also explores a brief 10% lapse in TC from 71% to 61% over the Thanksgiving holiday period (11/25 to 11/29) and also the Christmas holiday period (12/24 to 1/2/2021) as indicated by the yellow line, a brief 20% lapse in TC from 71% to 51% over the Thanksgiving holiday period (11/25 to 11/29) and also the Christmas holiday period (12/24 to 1/2/2021) as indicated by the dark red line, and a brief 30% lapse in TC from 71% to 41% over the Thanksgiving holiday period (11/25 to 11/29) and also the Christmas holiday period (12/24 to 1/2/2021) as indicated by the coral line. These time periods are represented by the grey shaded regions on the graph. At the end of a lapse period, TC is assumed to return to the level of TC held previously before the lapse began, e.g., 71%. Horizontal dashed lines indicate capacity limits for all hospitalizations (6,460 med/surg beds available for COVID-19 patients) and critical care (1,325 ICU beds available for COVID-19 patients). Figures on hospital capacity limits are provided by CDPHE.
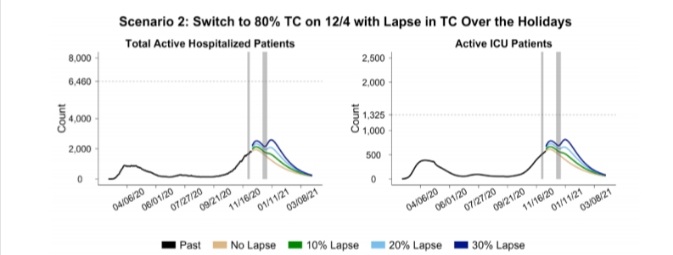 Figure 14 (above). Projected daily total number of patients actively hospitalized for COVID-19 (left) and active COVID-19 ICU patients (right), assuming transmission control switches to 80% indefinitely on Friday, 12/4 as indicated by the beige line. This scenario also explores a brief 10% lapse in TC from 71% to 61% over the Thanksgiving holiday period (11/25 to 11/29) and from 80% to 70% over the Christmas holiday period (12/24 to 1/2/2021) as indicated by the green line, a brief 20% lapse in TC from 71% to 51% over the Thanksgiving holiday period (11/25 to 11/29) and from 80% to 60% over the Christmas holiday period (12/24 to 1/2/2021) as indicated by the light blue line, and a brief 30% lapse in TC from 71% to 41% over the Thanksgiving holiday period (11/25 to 11/29) and from 80% to 50% over the Christmas holiday period (12/24 to 1/2/2021) as indicated by the dark blue line. These time periods are represented by the grey shaded regions on the graph. At the end of a lapse period, TC is assumed to return to the level of TC held previously before the lapse began. Horizontal dashed lines indicate capacity limits for all hospitalizations (6,460 med/surg beds available for COVID-19 patients) and critical care (1,325 ICU beds available for COVID-19 patients). Figures on hospital capacity limits are provided by CDPHE.
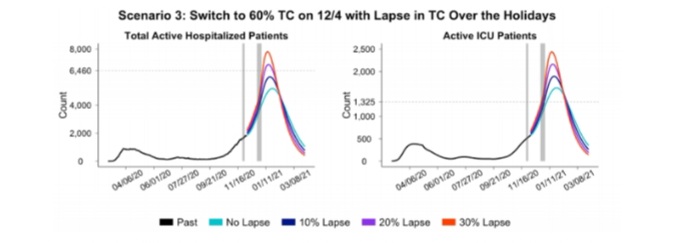 Figure 15 (above). Projected daily total number of patients actively hospitalized for COVID-19 (left) and active COVID-19 ICU patients (right), assuming transmission control switches to 60% indefinitely on Friday, 12/4 as indicated by the turquoise line. This scenario also explores a brief 10% lapse in TC from 71% to 61% over the Thanksgiving holiday period (11/25 to 11/29) and from 60% to 50% over the Christmas holiday period (12/24 to 1/2/2021) as indicated by the blue line, a brief 20% lapse in TC from 71% to 51% over the Thanksgiving holiday period (11/25 to 11/29) and from 60% to 40% over the Christmas holiday period (12/24 to 1/2/2021) as indicated by the purple line, and a brief 30% lapse in TC from 71% to 41% over the Thanksgiving holiday period (11/25 to 11/29) and from 60% to 30% over the Christmas holiday period (12/24 to 1/2/2021) as indicated by the red line. These time periods are represented by the grey shaded regions on the graph. At the end of a lapse period, TC is assumed to return to the level of TC held previously before the lapse began. Horizontal dashed lines indicate capacity limits for all hospitalizations (6,460 med/surg beds available for COVID-19 patients) and critical care (1,325 ICU beds available for COVID-19 patients). Figures on hospital capacity limits are provided by CDPHE.
Table 2 (below). Comparison of the projected date that ICU surge capacity is reached, the date that ICU demand peaks, the estimated number of ICU beds needed at the peak, and the cumulative COVID-19 deaths at different levels of transmission control.
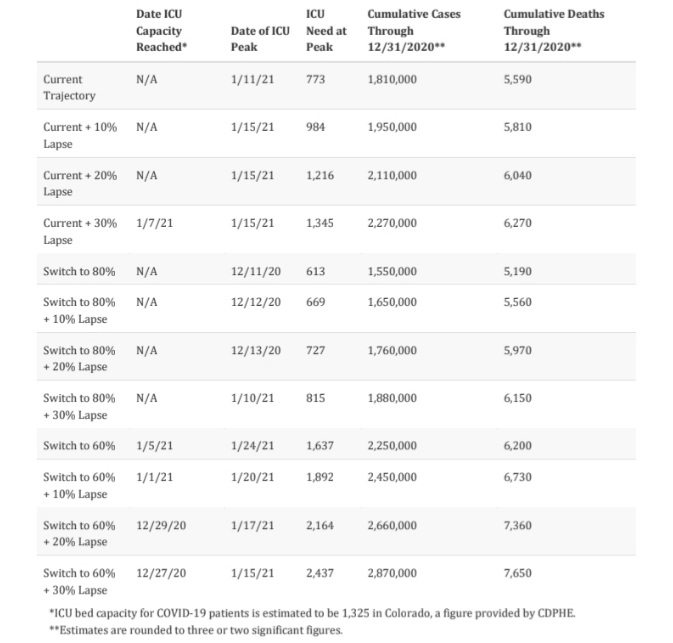
*ICU bed capacity for COVID-19 patients is estimated to be 1,325 in Colorado, a figure provided by CDPHE.
**Estimates are rounded to three or two significant figures.
Appendix
Code, Documentation, and Prior Reports
Code for our model is available on GitHub: https://github.com/agb85/covid-19 Documentation for the model can be found at: https://agb85.github.io/covid-19/SEIR%20Documentation.pdf
Prior modeling reports and documentation can be found at: https://agb85.github.io/covid-19/
Model Fit
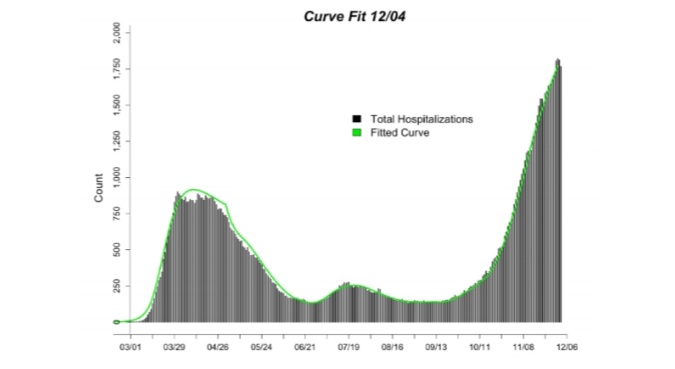 Figure A1 (above). Current model fit (green line) to the count of hospitalized COVID-19 cases (black lines) through 11/30 using the age-structured SEIR model. Hospitalized COVID-19 cases are from CDPHE reported COVID-19 hospitalizations and EMResource (EMR) hospital census data provided by CDPHE.
Appendix Table A1 (below). Estimated model parameters based on fitting our model output of total hospitalizations to reported hospitalizations in Colorado. The new “TC” model includes a single transmission control parameter that accounts for all reduction in effective contacts as a result of all policy and behavior changes to reduce transmission.
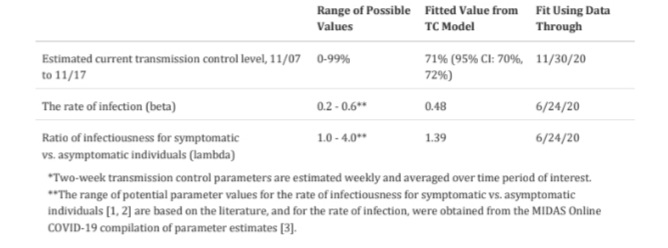 *Two-week transmission control parameters are estimated weekly and averaged over time period of interest.
**The range of potential parameter values for the rate of infectiousness for symptomatic vs. asymptomatic individuals [1, 2] are based on the literature, and for the rate of infection, were obtained from the MIDAS Online COVID-19 compilation of parameter estimates [3].
References
1. Li R, Pei S, Chen B, Song Y, Zhang T, Yang W, et al. Substantial undocumented infection facilitates the rapid dissemination of novel coronavirus (SARS-CoV-2). Science. 2020;368(6490):489-93. Epub 2020/03/18.
doi: 10.1126/science.abb3221. PubMed PMID: 32179701; PubMed Central PMCID: PMCPMC7164387.
2. Zou L, Ruan F, Huang M, Liang L, Huang H, Hong Z, et al. SARS-CoV-2 Viral Load in Upper Respiratory Specimens of Infected Patients. The New England journal of medicine. 2020;382(12):1177-9. Epub 2020/02/20. doi: 10.1056/NEJMc2001737. PubMed PMID: 32074444; PubMed Central PMCID: PMCPMC7121626.
3. MIDAS. MIDAS Online COVID-19 Portal 2020. Available from: https://github.com/midas-network/COVID-
19/tree/master/parameter_estimates/2019_novel_coronavirus.
Follow SECO News on Facebook.
Subscribe to the SECO News YouTube Channel.
Press releases Sponsor

Healthcare Sponsor


.png)


.png)


.png)


.png)